Counting Mead Blops
Ever since living beings became conscious, it seems, that a great deal of them longs to dampen said consciousness. A fun and tasty way to do so is making your own alcohol. This may be beer or wine or when your are lucky to have access to larger amounts of honey: mead.
While brewing a half decent beverage isn't that hard alltogether and most of the work is actually done by our little friends saccharomyces, many different policies or recipes exist. One of the tricky things is to end up with just the right amount sugar in the end product, without too much sugar in the beginning which would slow fermentation. I like to follow an approach that boils down to the following steps:
- Start with (too) little sugar/honey
- When fermentation slows down, add honey to taste
- Wait if fermentation continues/increases and go back to step 2.
- When fermentation ceases completely - most likely due to the alcohol concentration reaching the yeast's tolerance - add honey to taste one last time
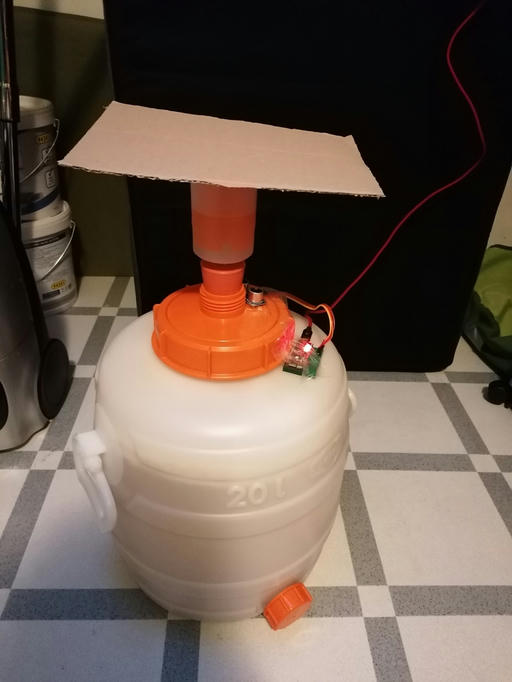
The benefit of this method is, that you don't really have to measure sugar concentrations and get to taste and accompany your beverage :-) Also, in theory, your beverage shouldn't continue to ferment when bottled. However, some exploding specimens tell me otherwise sometimes. Anyway, how do you keep track of fermentation, preferably autonomously? There is this neat gadget, continuously measuring the density of the liquid it's dispersed in by determining the angle of inclination: iSPindel. This calls for serious investment and planning and I needed a solution for a nightly build. My Idea was to track the rise and fall of the airlock lid. A commercially available product uses magnets and Hall sensors, which didn't work to well for me. Instead I used a SR04 ultrasonic range sensor attached to an ESP32, continuously pushing data into my influxDB. The cardboard added on top ensured the ultrasonic waves were reflected sufficiently.
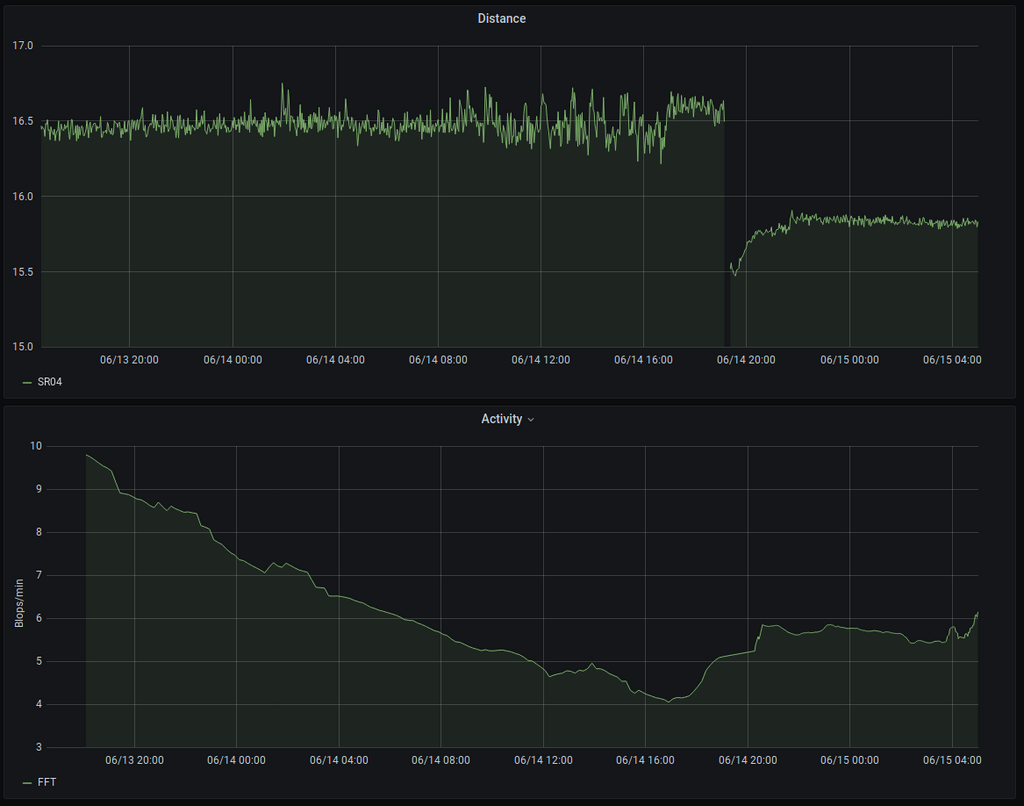
The raw data was really noisy and not useful in any way. Therefore, a cron job was used to run a python script every 15 minutes, pulling the last hour of data and applying SciPy's fast Fourier transform to find the most prominent frequency, which should be proportional to the ups and downs of the lid:
#!/usr/bin/env python3
import influxdb
import pandas as pd
from scipy import fft
import numpy as np
import time
client = influxdb.InfluxDBClient(host='host',username='user',password='password')
client.switch_database('fermentation')
res = client.query('SELECT "dist" FROM "SR" WHERE time > now()-1h') # Get 1 hour worth of raw distance data
points = res.get_points()
x,y = [],[]
for p in points:
    x.append(pd.to_datetime(p['time']))
    y.append(p['dist'])

df = pd.DataFrame(y,x,columns=['dist'])
d = df.resample('1s').median() # resample to seconds for an even distribution of time buckets
d = d.fillna(method='ffill')
yf = fft(np.array(d['dist']))
n2 =len(d)+1
n = int(0.5+n2/2)
xf = np.array([1/n2*i if i < n else -1/n2*(n2-i) for i in range(n2)])
yf = np.real(yf)
mask = yf.argsort()[-9:][::-1] # Take 8 most intense frequencies
m = np.mean(abs(xf[mask])[1:]) # The mean turns out to be robust enough
m *= 120
The code is neither clean nor super accurate, but it came together quickly and worked: The decline of the fermentation activity is clearly visible. The disruption of the raw data indicates the time I saw fit to add more honey. And indeed, the activity was increasing afterwards.
Cheers!